Featured image of post Improve your Matplotlib plots with this post

Improve your Matplotlib plots with this post

How to config the style of matplotlib plots

Rules for better figures

I found the defaults of Matplotlib fairly reasonable. Is fine for many purposes. But it kinda breaks many of the Ten simple rules for better figures1. Just to mention one, the Rule 5: Do not trust the defaults. The main reason is to respect the other rules. In general, not following rule 5 works against Rule 1: Know Your Audience. In some other cases, it breaks Rule 8: Avoid “Chartjunk”. For example, if your data involves only two variables, you should have only two axes.

How I go about it

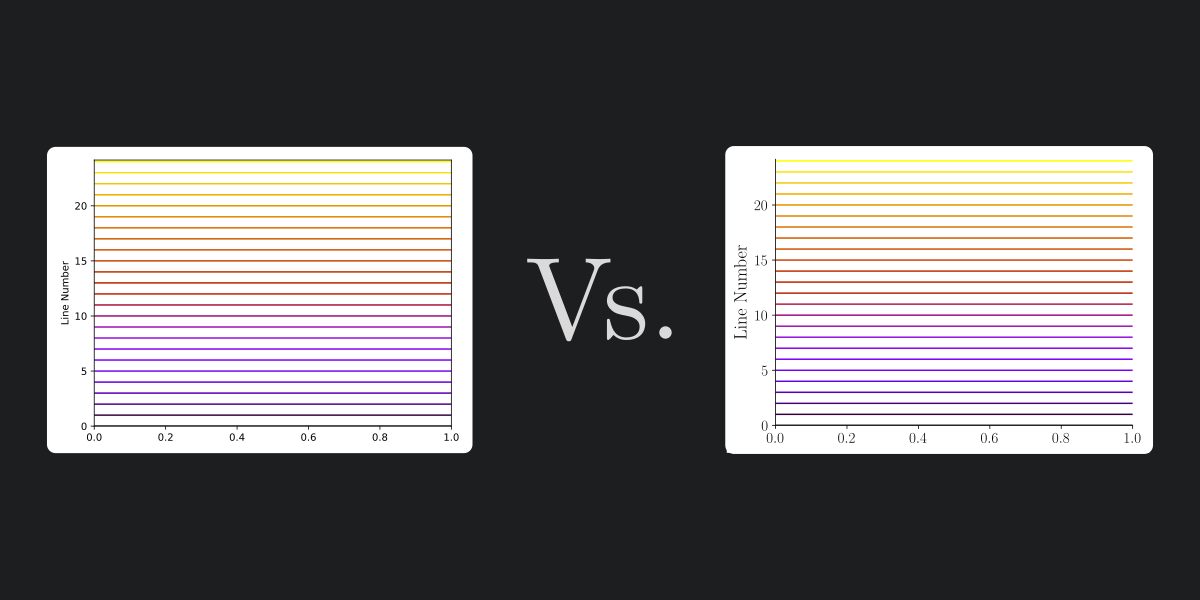
I have a custom style for plots that is more to my taste. The cover of this blog post has a comparison between two examples of the default Matplotlib style and my config.

Let’s take a closer look. The default Matplotlib style looks like this:

line_numbersUgly

If we apply my config, we can have it look like this:

line_numbers

Let’s learn how to set this style up.

Method A: The config file way

If you want more information about the Matplotlib config file, go here.

  1. Set the style: This style is achieved with this config file
 1
 2
 3
 4
 5
 6
 7
 8
 9
10
11
12
13
14
15
16
17
18
19
20
21
font.family:       serif 
font.size:         12 

text.usetex:       True  # use LaTeX for all text handling.

axes.titlesize:    15    # fontsize of the axes title
axes.labelsize:    18    # fontsize of the x any y labels
axes.spines.top:   False # display axis spines
axes.spines.right: False

xtick.bottom:      True  # draw ticks on the bottom side
xtick.color:       black # color of the ticks
xtick.labelsize:   15    # fontsize of the tick labels

ytick.left:        True  # draw ticks on the left side
ytick.color:       black # color of the ticks
ytick.labelsize:   15    # fontsize of the tick labels

legend.fontsize:   12    # medium

pgf.rcfonts:       False
  1. Save the config file on step 1 as myStyle.mplstyle. Once you load it all plots ran after it will have the custom style. You can load it with:
1
2
import matplotlib.pyplot as plt
plt.style.use('myStyle.mplstyle')

Alternative step 2

    • For a local config: Save the file as matplotlibrc in the current directory.
    • For a global config: Save the file as matplotlibrc to the directory shown by matplotlib.matplotlib_fname():
1
2
3
>>> import matplotlib
>>> matplotlib.matplotlib_fname() # show current matplotlibrc
'/home/foo/.config/matplotlib/matplotlibrc'

Method B: The dictionary way

There are other alternatives to achieve this style. The plt.style.use function accepts preferences as a dictionary:

 1
 2
 3
 4
 5
 6
 7
 8
 9
10
11
12
13
14
15
16
17
18
19
import matplotlib.pyplot as plt
style_args = {
    "font.family":       "serif",
    "font.size":         12,
    "text.usetex":       True,
    "axes.titlesize":    15,
    "axes.labelsize":    18,
    "axes.spines.top":   False,
    "axes.spines.right": False,
    "xtick.bottom":      True,
    "xtick.color":       "black",
    "xtick.labelsize":   15,
    "ytick.left":        True,
    "ytick.color":       "black",
    "ytick.labelsize":   15,
    "legend.fontsize":   12,
    "pgf.rcfonts":       False,
}
plt.style.use(style_args)


Invitame un café en cafecito.app


  1. Rougier NP, Droettboom M, Bourne PE (2014) Ten Simple Rules for Better Figures. PLoS Comput Biol 10(9): e1003833. https://doi.org/10.1371/journal.pcbi.1003833 ↩︎

Built with Hugo
Theme Stack designed by Jimmy